The Analytics page, explained
Last updated: August 17, 2026
Everything Salesfinity tracks about your calling — activity, connect rates, list health, AI scorecards, rep coaching profiles, and full call history — lives under:
Dashboard → Analytics.
This master guide walks through every tab, the shared filters that power them all, and the most common questions.
In this article
The nine analytics tabs
Shared filters & saved views
Activity Report
Connect Rate
List Performance
Battlecards
SDR Profile
SDR Benchmarking
Scorecards (AI call scoring)
Breakdown
Call History
Exporting your data
Metric definitions
FAQ
The nine analytics tabs
The Analytics page is organized into tabs along the top:
Activity Report Connect Rate List Performance Battlecards SDR Profile SDR Benchmarking Scorecards Breakdown Call history
All tabs are available on every Salesfinity plan. What individual users can see inside them depends on their role — see shared filters below.
Shared filters & saved views
Date range
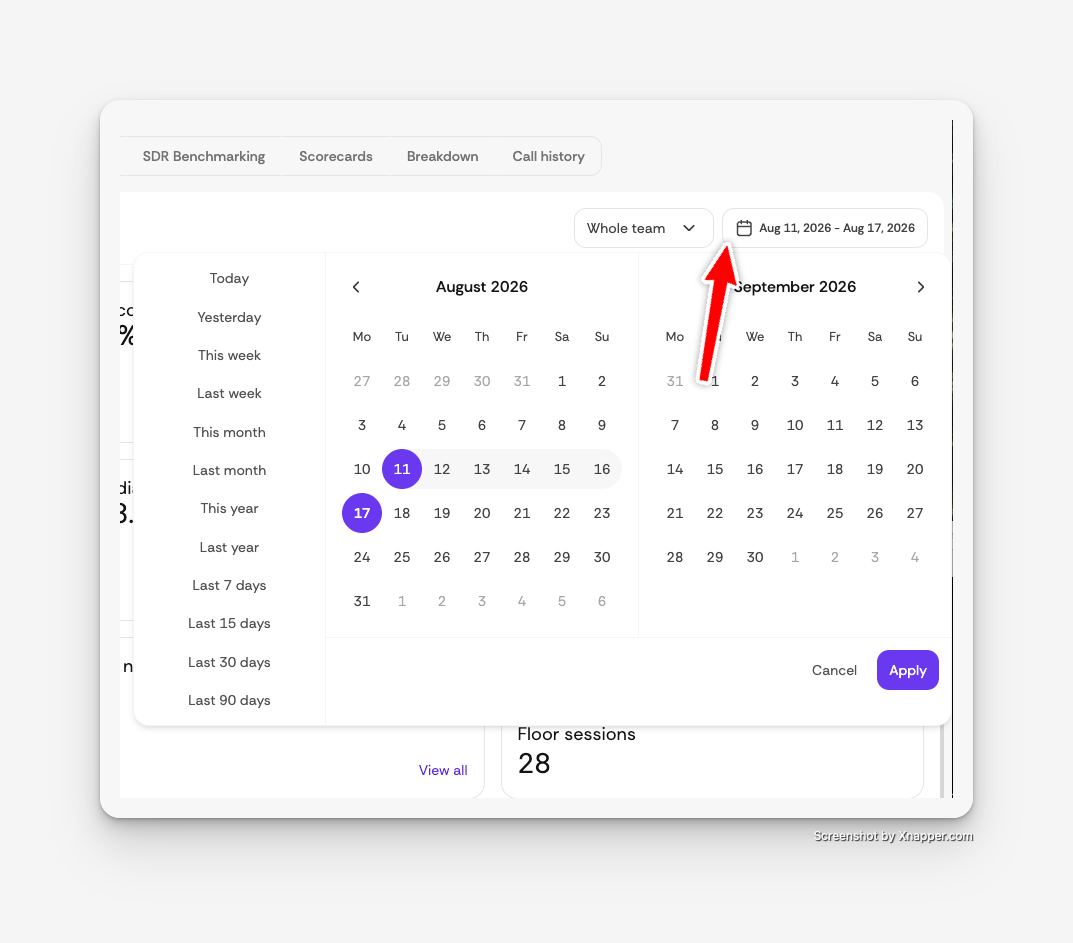
Most tabs share one date range picker with quick presets — Today, Yesterday, This week, Last week, This month, Last month, This year, Last year, Last 7 days, Last 15 days, Last 30 days, Last 90 days — plus a custom calendar range. Most tabs default to Last 7 days; Call History and Scorecards default to Last 30 days. Your selection sticks for the rest of your session.
Team member filter
The user selector next to the date picker scopes every chart and table to the reps you choose. Owners and admins (and members whose team-call-history access hasn't been restricted) can pick any teammates or select Whole Team; other members see their own data only.
Saved views
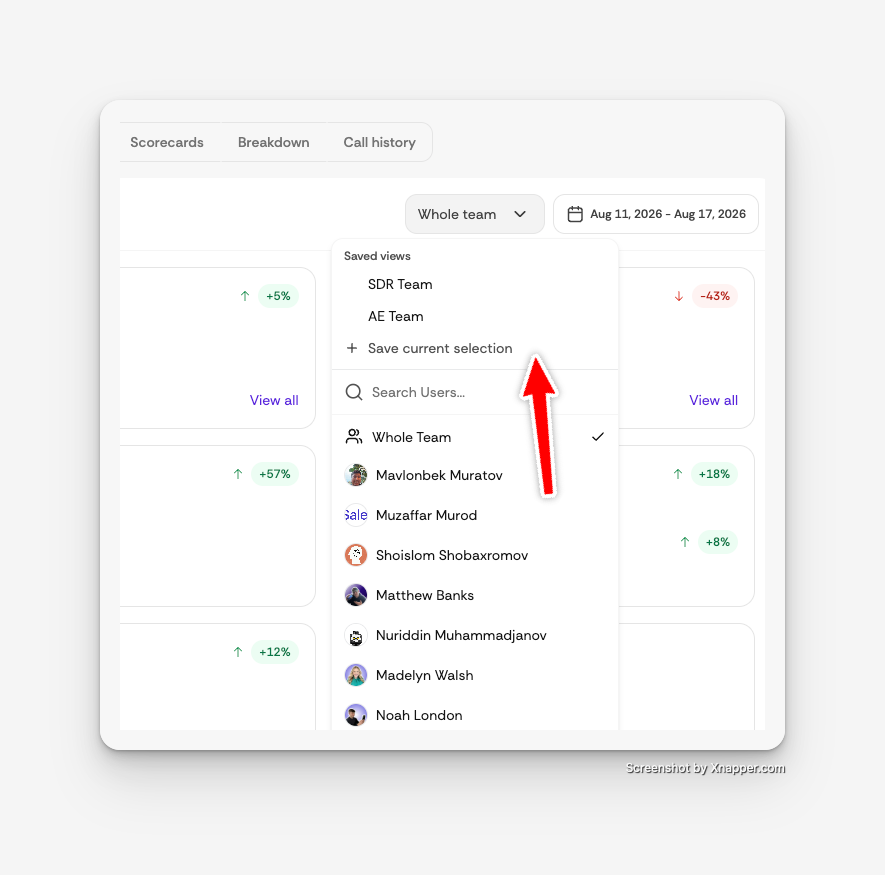
If you regularly look at the same group of reps — a pod, a region, new hires — save the selection as a view:
Open the team member filter and click Save current selection, then name the view.
Saved views appear at the top of the filter for one-click switching, and can be renamed or deleted anytime.
Mark one view Set as default and Analytics will open scoped to it automatically.
Tip
Filter selections are reflected in the page URL on Call History and Scorecards — copy the address bar to share an exact filtered view with a teammate.
Activity Report
The landing tab — a snapshot of team output for the selected reps and dates.
Overview metrics
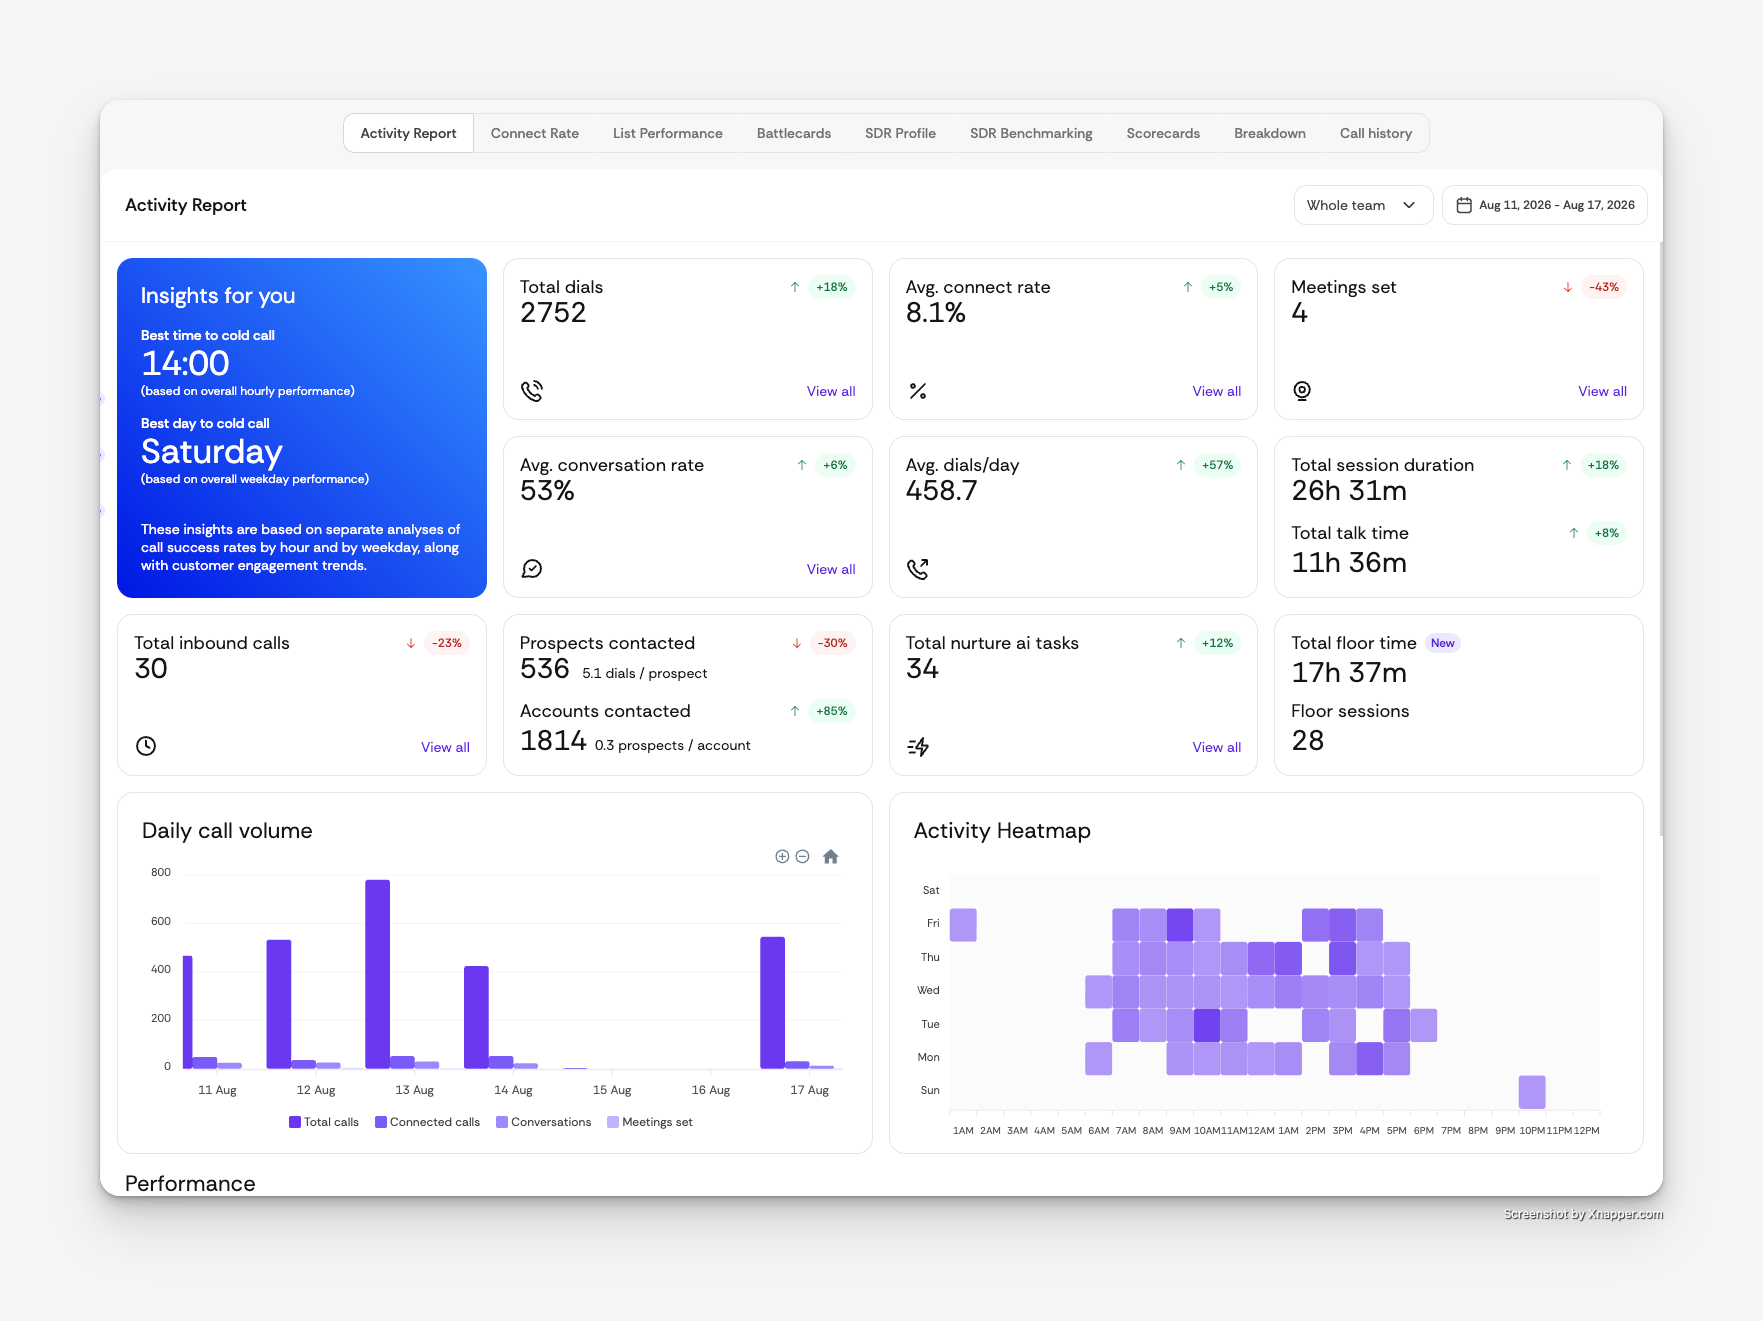
KPI cards with period-over-period growth indicators: Total dials, Avg. connect rate, Meetings set, Avg. conversation rate, Avg. dials/day, Total session duration (with total talk time), Total inbound calls, Prospects contacted (with accounts contacted and dials-per-prospect ratios), Total nurture AI tasks, and Total floor time / Floor sessions for Salesfloor usage. Cards with a View all link jump straight into Call History pre-filtered to those calls.
Insights for you
An automatic insights card showing your best time to cold call and best day to cold call, based on your own hourly and weekday success rates.
Charts and tables
Daily call volume — call volume per day (zoomable).
Activity Heatmap — when your team dials, by day and hour.
Best performing lists and Best performing users — top 5 by calls, meetings set, and data quality.
Calls by disposition — how calls are being logged.
Conversion Funnel — Connections → Conversations → Meetings set, each with its rate.
Connect Rate
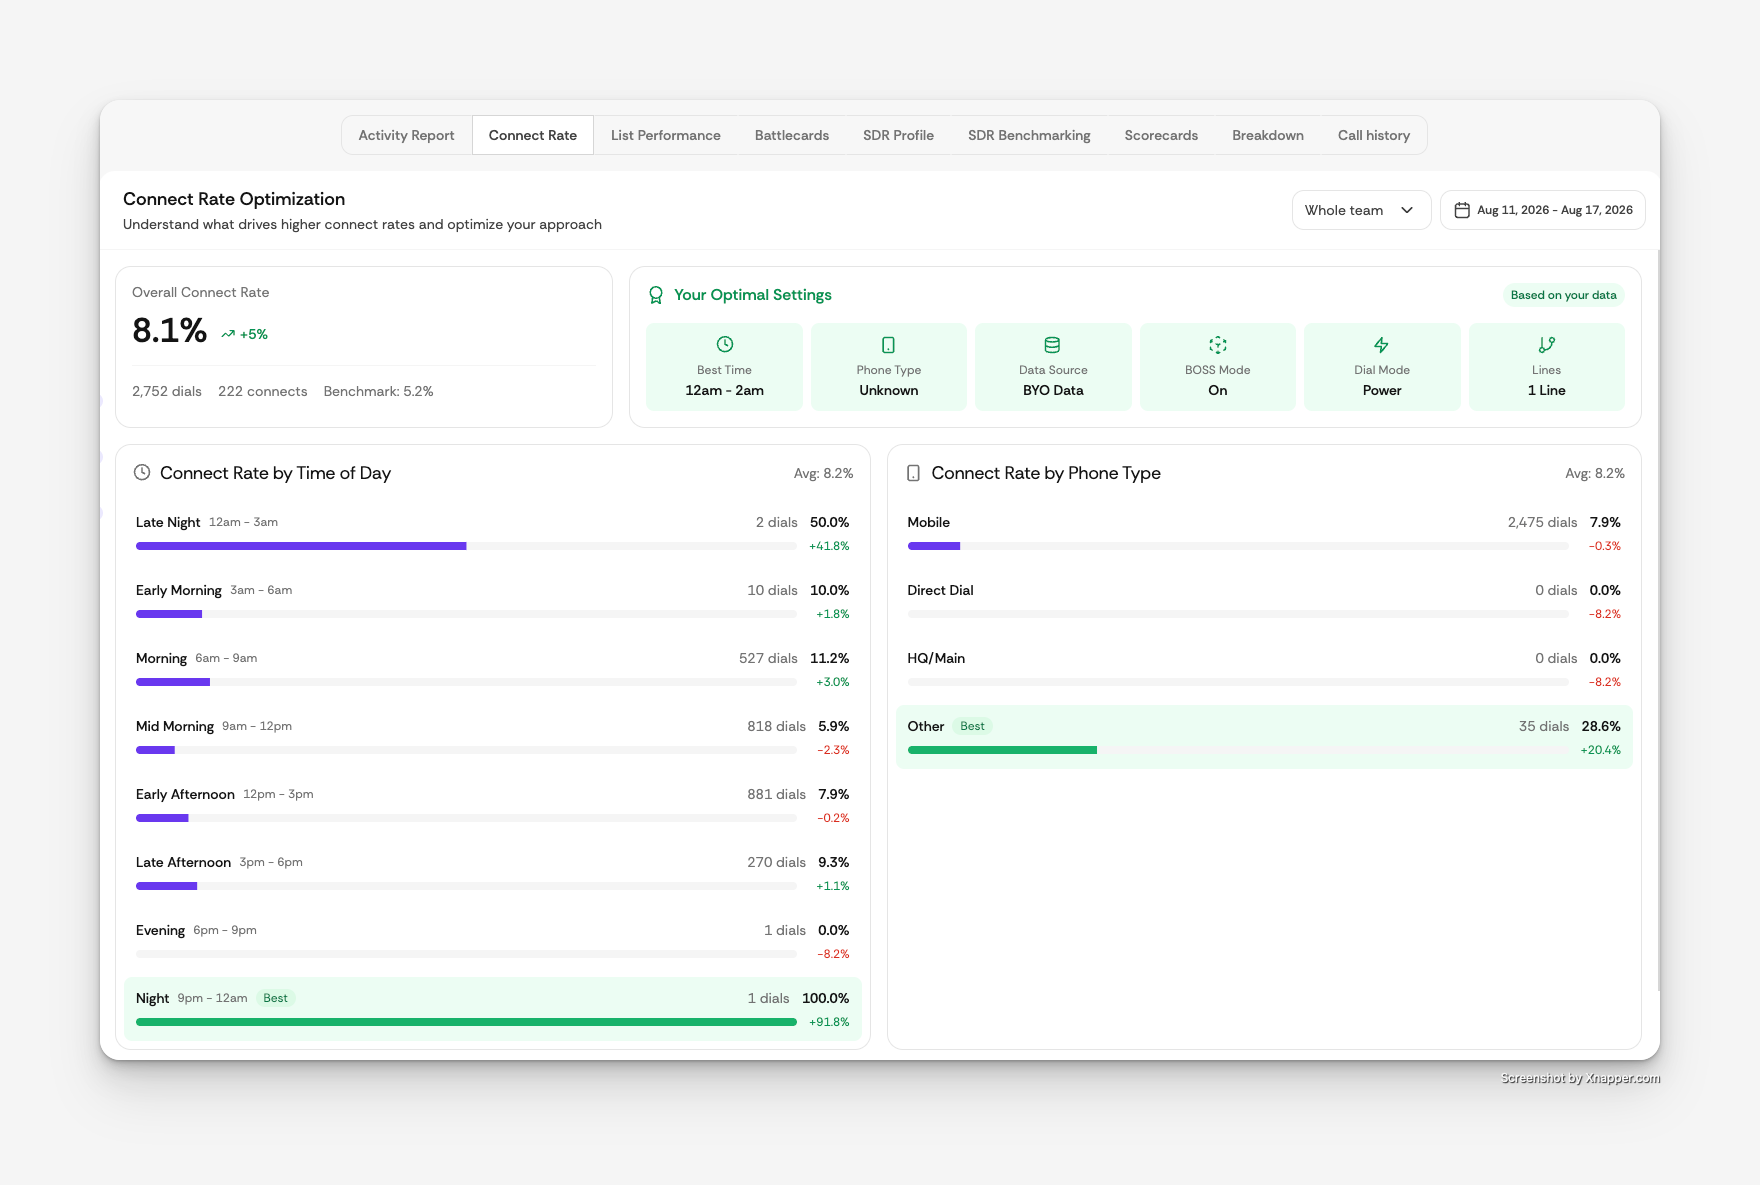
The Connect Rate Optimization tab answers one question: what actually drives your connect rate? It shows your overall connect rate against a 5.2% industry benchmark, a Your Optimal Settings card summarizing your best-performing time, phone type, data source, BOSS Mode setting, dial mode, and line count — all based on your own data — and then breaks connect rate down across six dimensions:
Time of day — eight 3-hour slots from late night to evening.
Phone type — Mobile vs. Direct Dial vs. HQ/Main.
Data source — Smart Enrich (AI-enriched numbers) vs. your own uploaded data, plus per-CRM sources.
Dial mode — how each dialing mode performs.
Parallel lines configuration — connect rate by number of simultaneous lines.
Number score — P1 / P2 / P3 / Unverified tiers. Only mobile numbers get scored; BOSS Mode dials P1 first, then P2, and skips P3.
Each breakdown highlights the Best performer and shows how far each option sits above or below your average.
List Performance
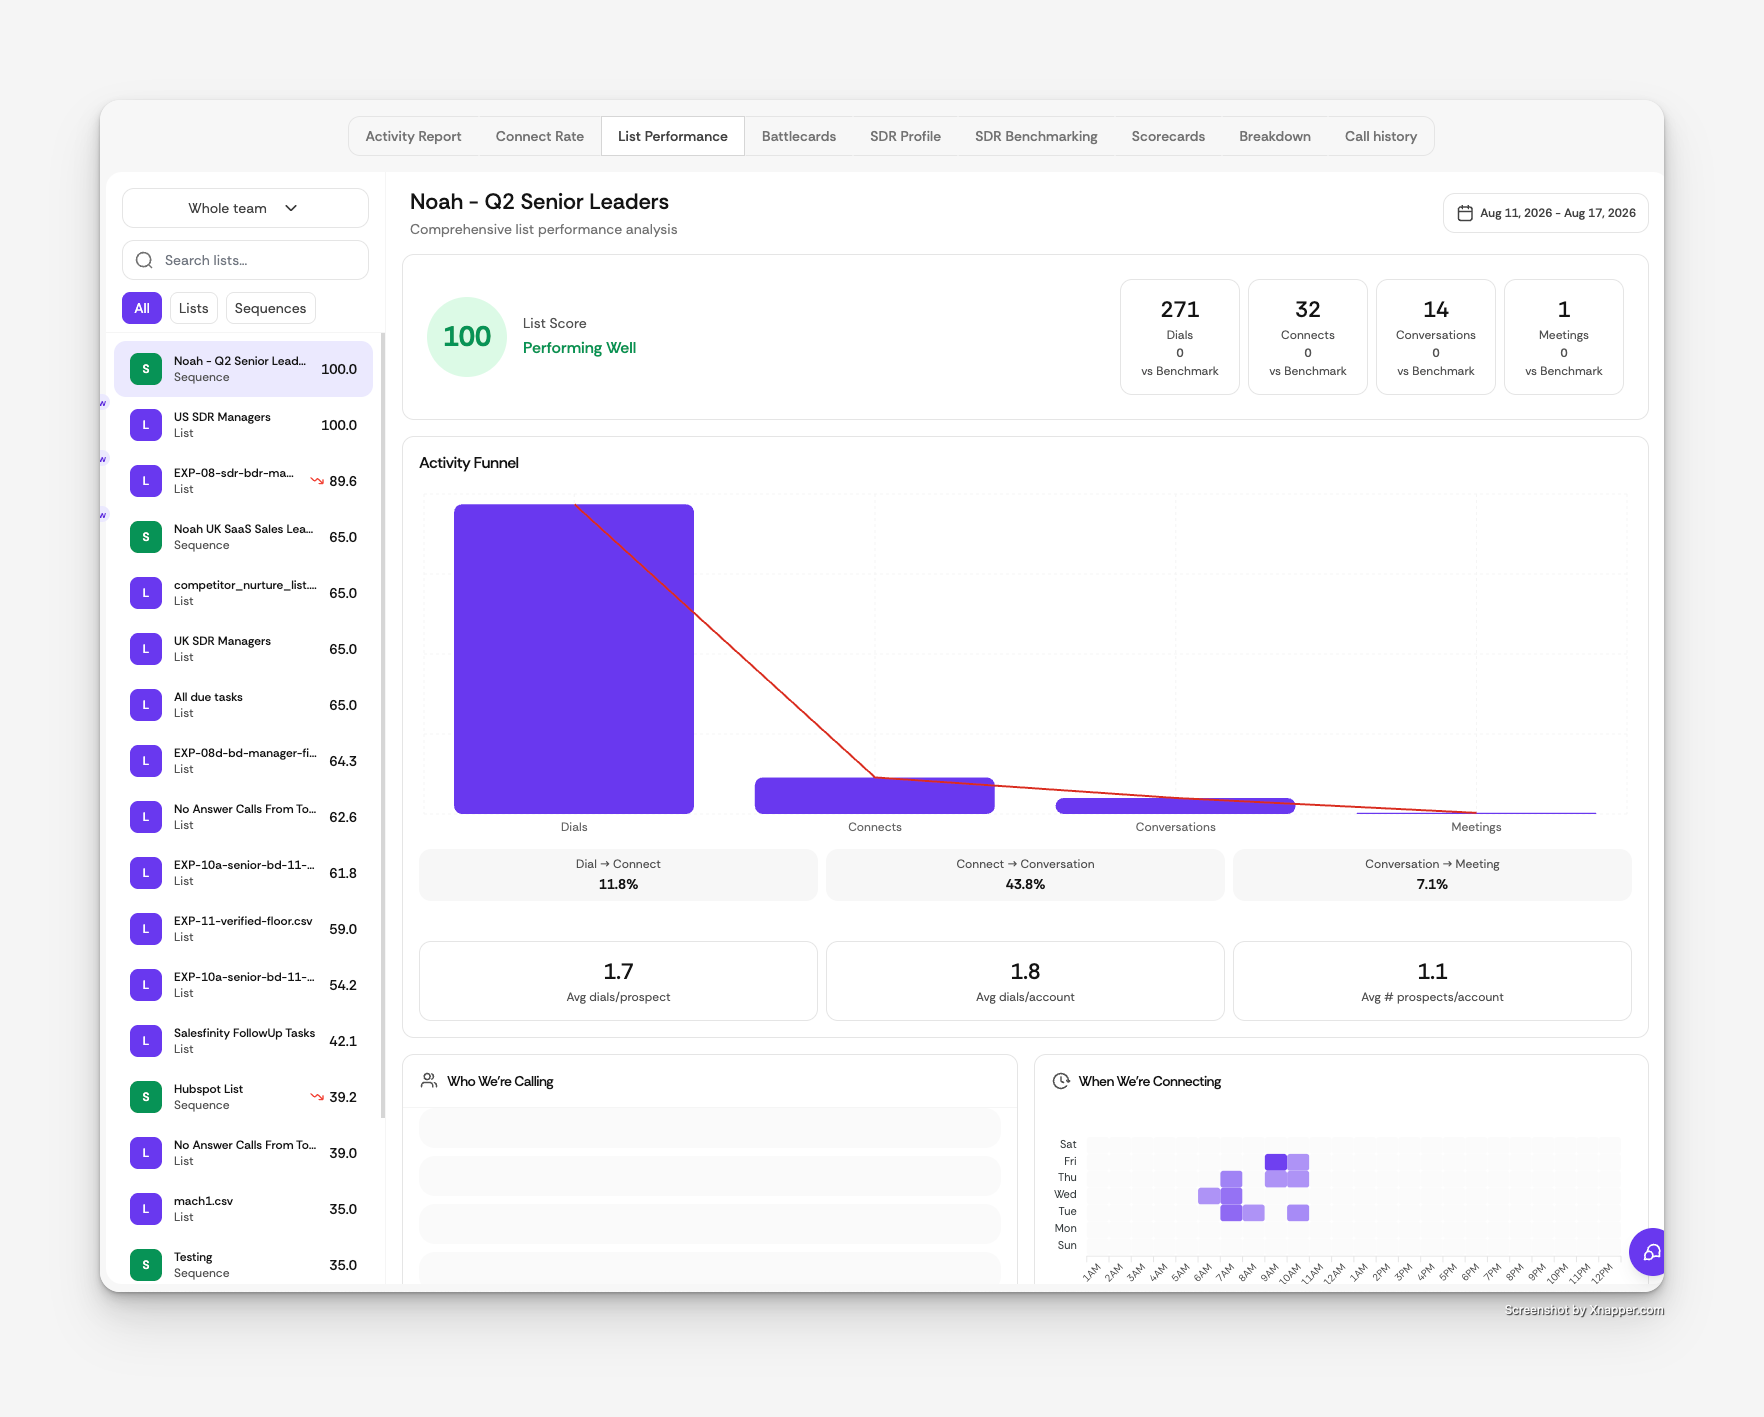
A deep-dive on any contact list or sequence. Pick a list from the left sidebar — searchable, filterable by All / Lists / Sequences, each entry showing its current score and whether it's trending up or down — and the page builds a full report:
List Score — a 0–100 health score with a status: Performing Well (70+), Needs Attention (50–69), or Critical (below 50) — alongside Dials, Connects, Conversations, and Meetings.
Activity Funnel — the conversion funnel for this list, plus average dials per prospect, dials per account, and prospects per account.
Who We're Calling — a seniority breakdown (Individual Contributor through C-Suite) with prospects, dials, connects, and connect rate per level.
When We're Connecting — a day × hour heatmap of when this list actually connects.
What They're Saying — AI insights from call transcripts: the list's Top Objections, Positive Signals, and Overall Sentiment (positive / neutral / negative). A Listen to calls from this list link jumps to Call History filtered to just this list's calls.
Battlecards
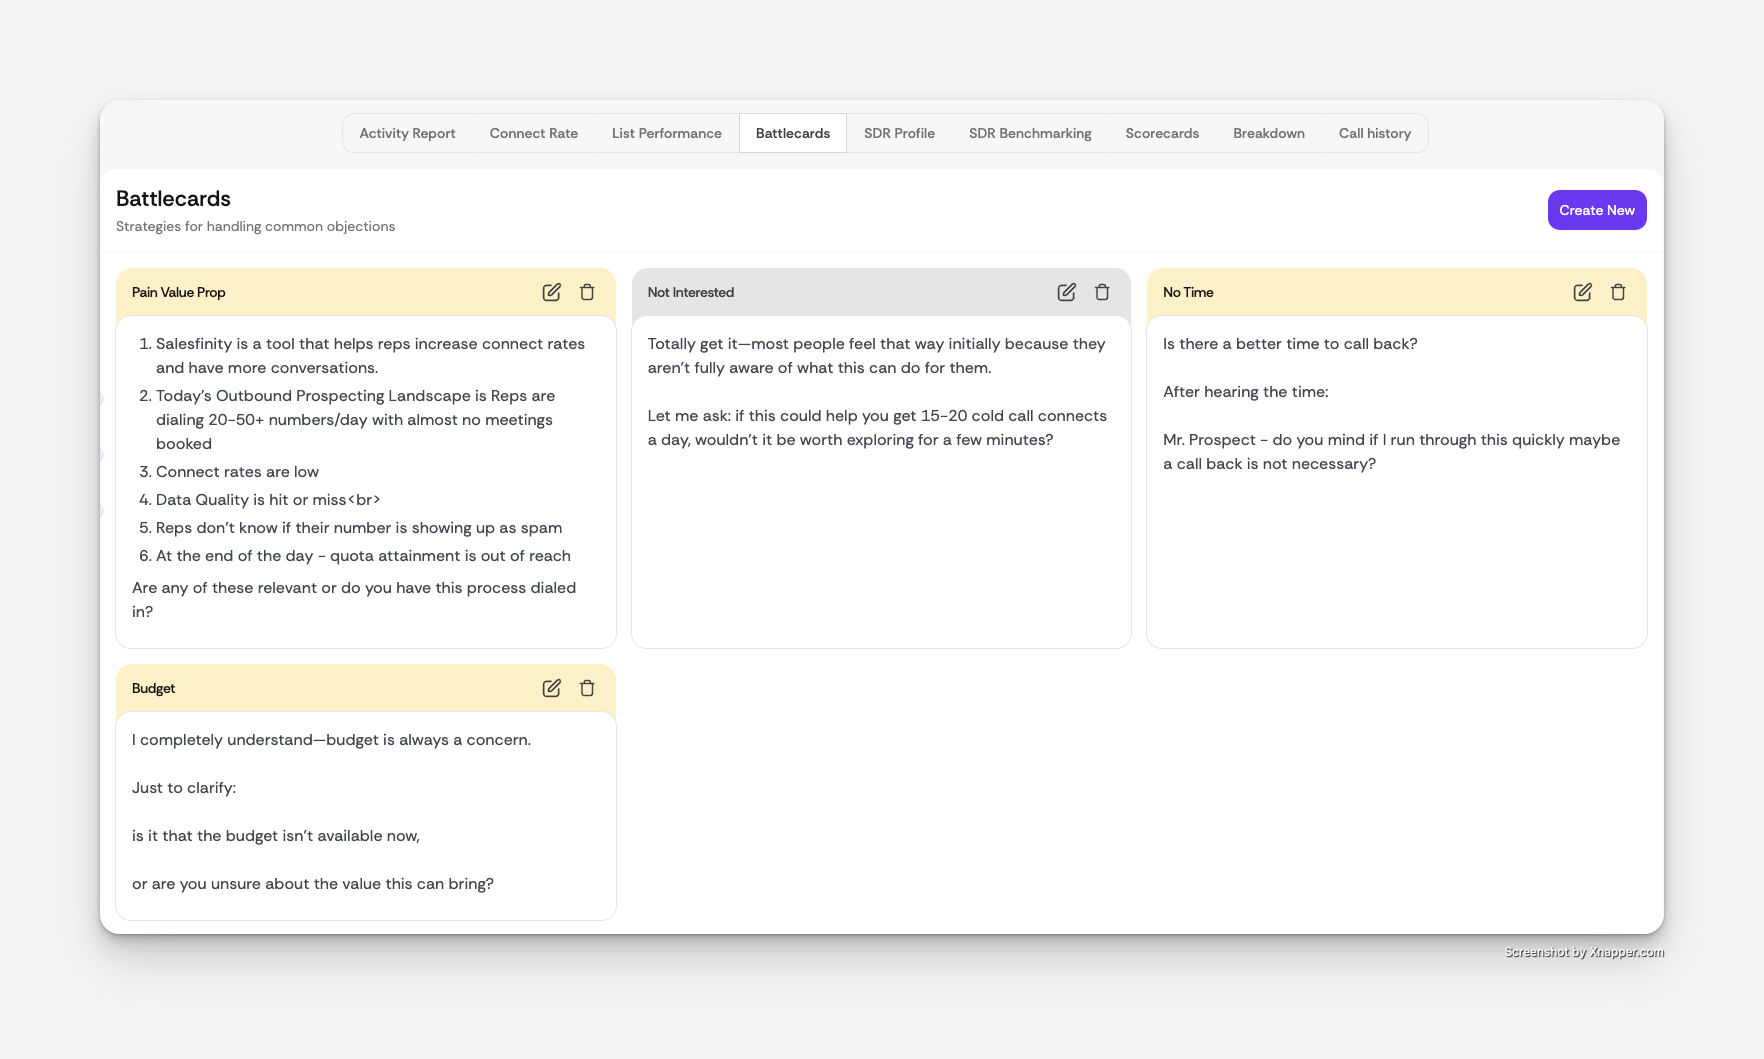
A shared library of objection-handling strategies your reps see during live calls (in the contact panel's Battlecards tab). From the analytics Battlecards tab you can:
Click Create New to write a battlecard — a name (e.g. “Budget”) plus a rich-text body.
Edit or delete existing cards with the pencil and trash icons.
New cards are available to the team immediately.
SDR Profile
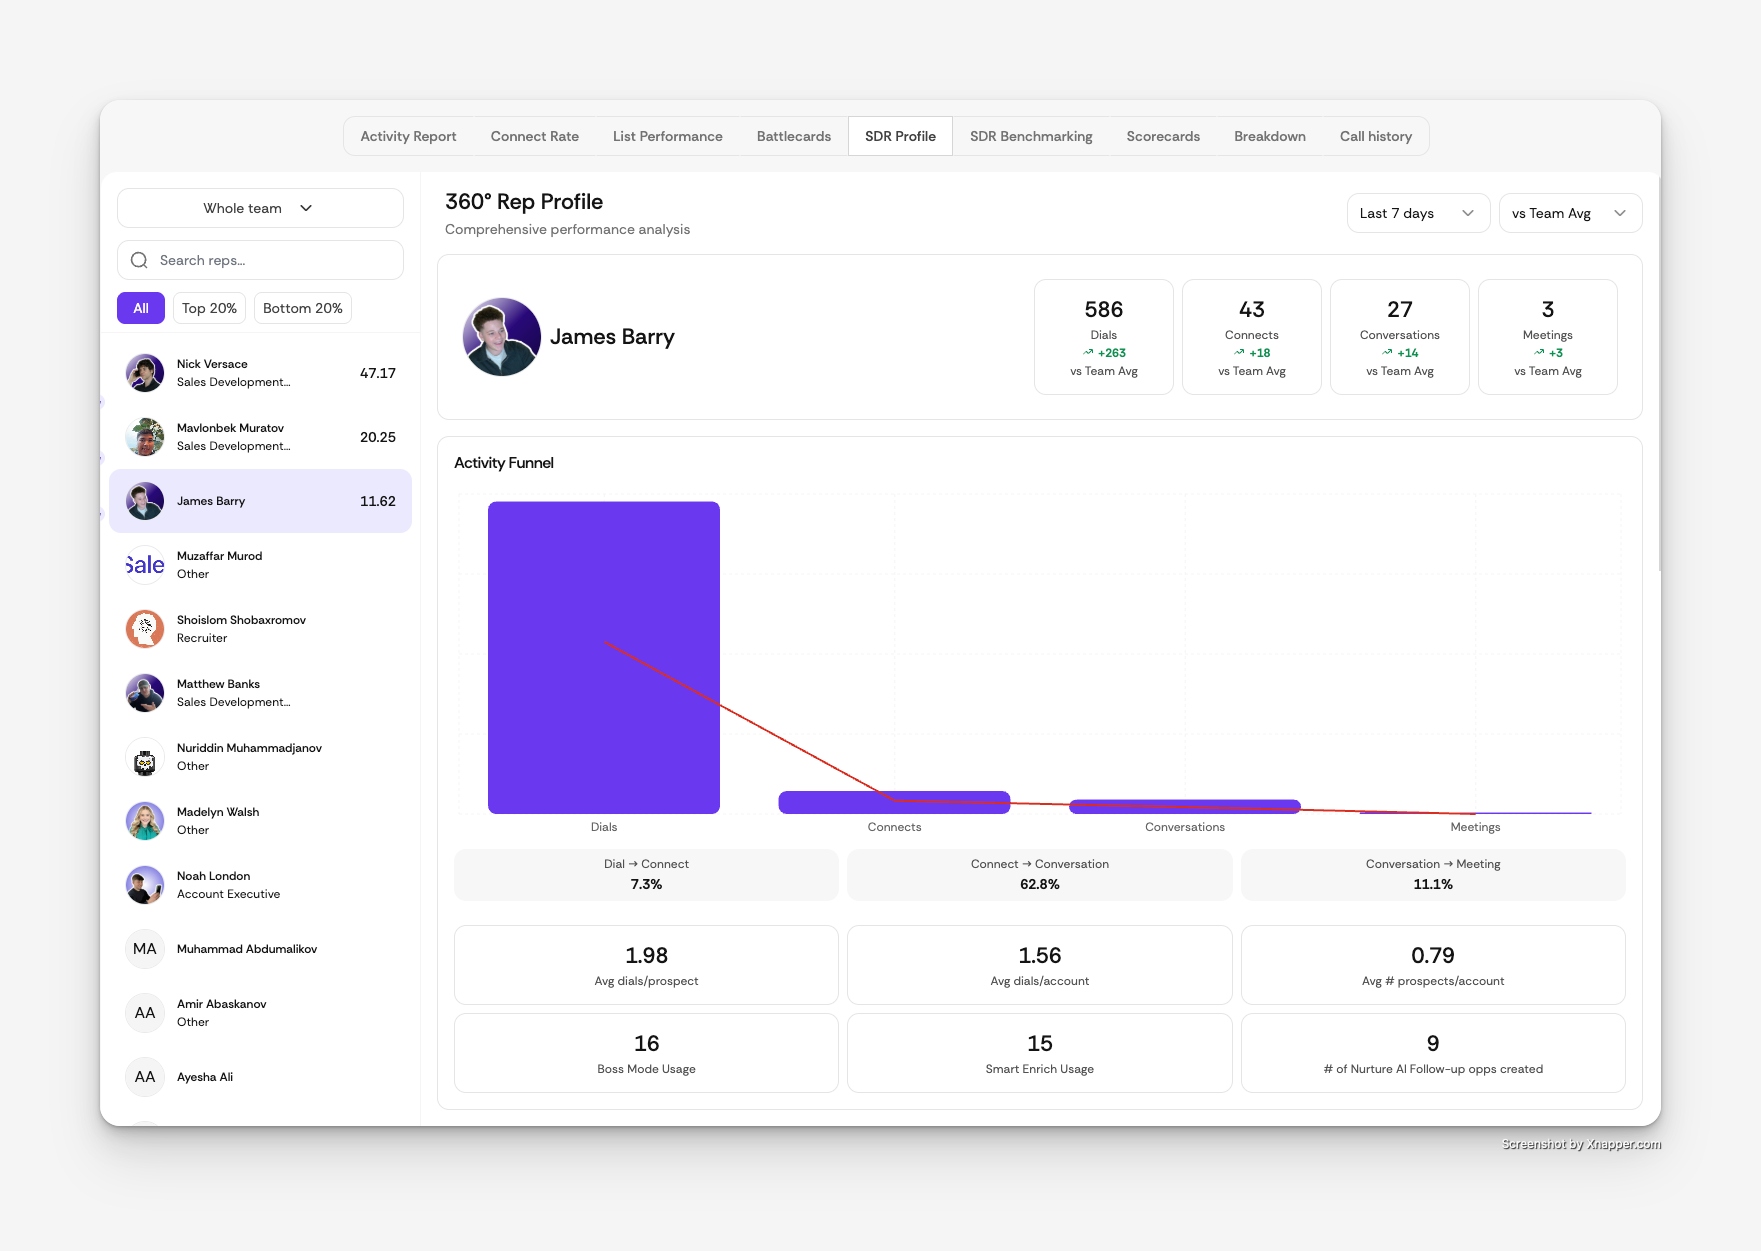
A 360° performance profile for a single rep, built from their activity and AI call analysis. Pick a rep from the left list — searchable, with All / Top 20% / Bottom 20% filters and a score trend per rep — then review:
Overview — Dials, Connects, Conversations, Meetings, each compared vs Team Avg, vs Top 10%, or vs Last Period (your choice), over the last 7, 30, or 90 days.
Activity Funnel — the rep's funnel against the comparison group, plus efficiency stats like dials per prospect, BOSS Mode usage, Smart Enrich usage, and Nurture AI follow-up opportunities created.
Process & Behavior Analysis — AI-measured call behaviors: opener length, pitch length, questions per call, % of calls with a CTA, speaking pace (WPM), and interruptions per call.
Overall Competency Across 6 Skills — a radar chart of Intro, Discovery, Pitch, Tonality, Objections, and CTA scores against the competency target.
Prospect Reactions — how prospects respond on this rep's calls (excited, skeptical, frustrated with current tool, etc.).
Objections & targeting — top 5 objections by frequency, % of objections handled, persona targeting (calls vs. book rate by seniority), and prospect lifecycle stages reached.
SDR Benchmarking
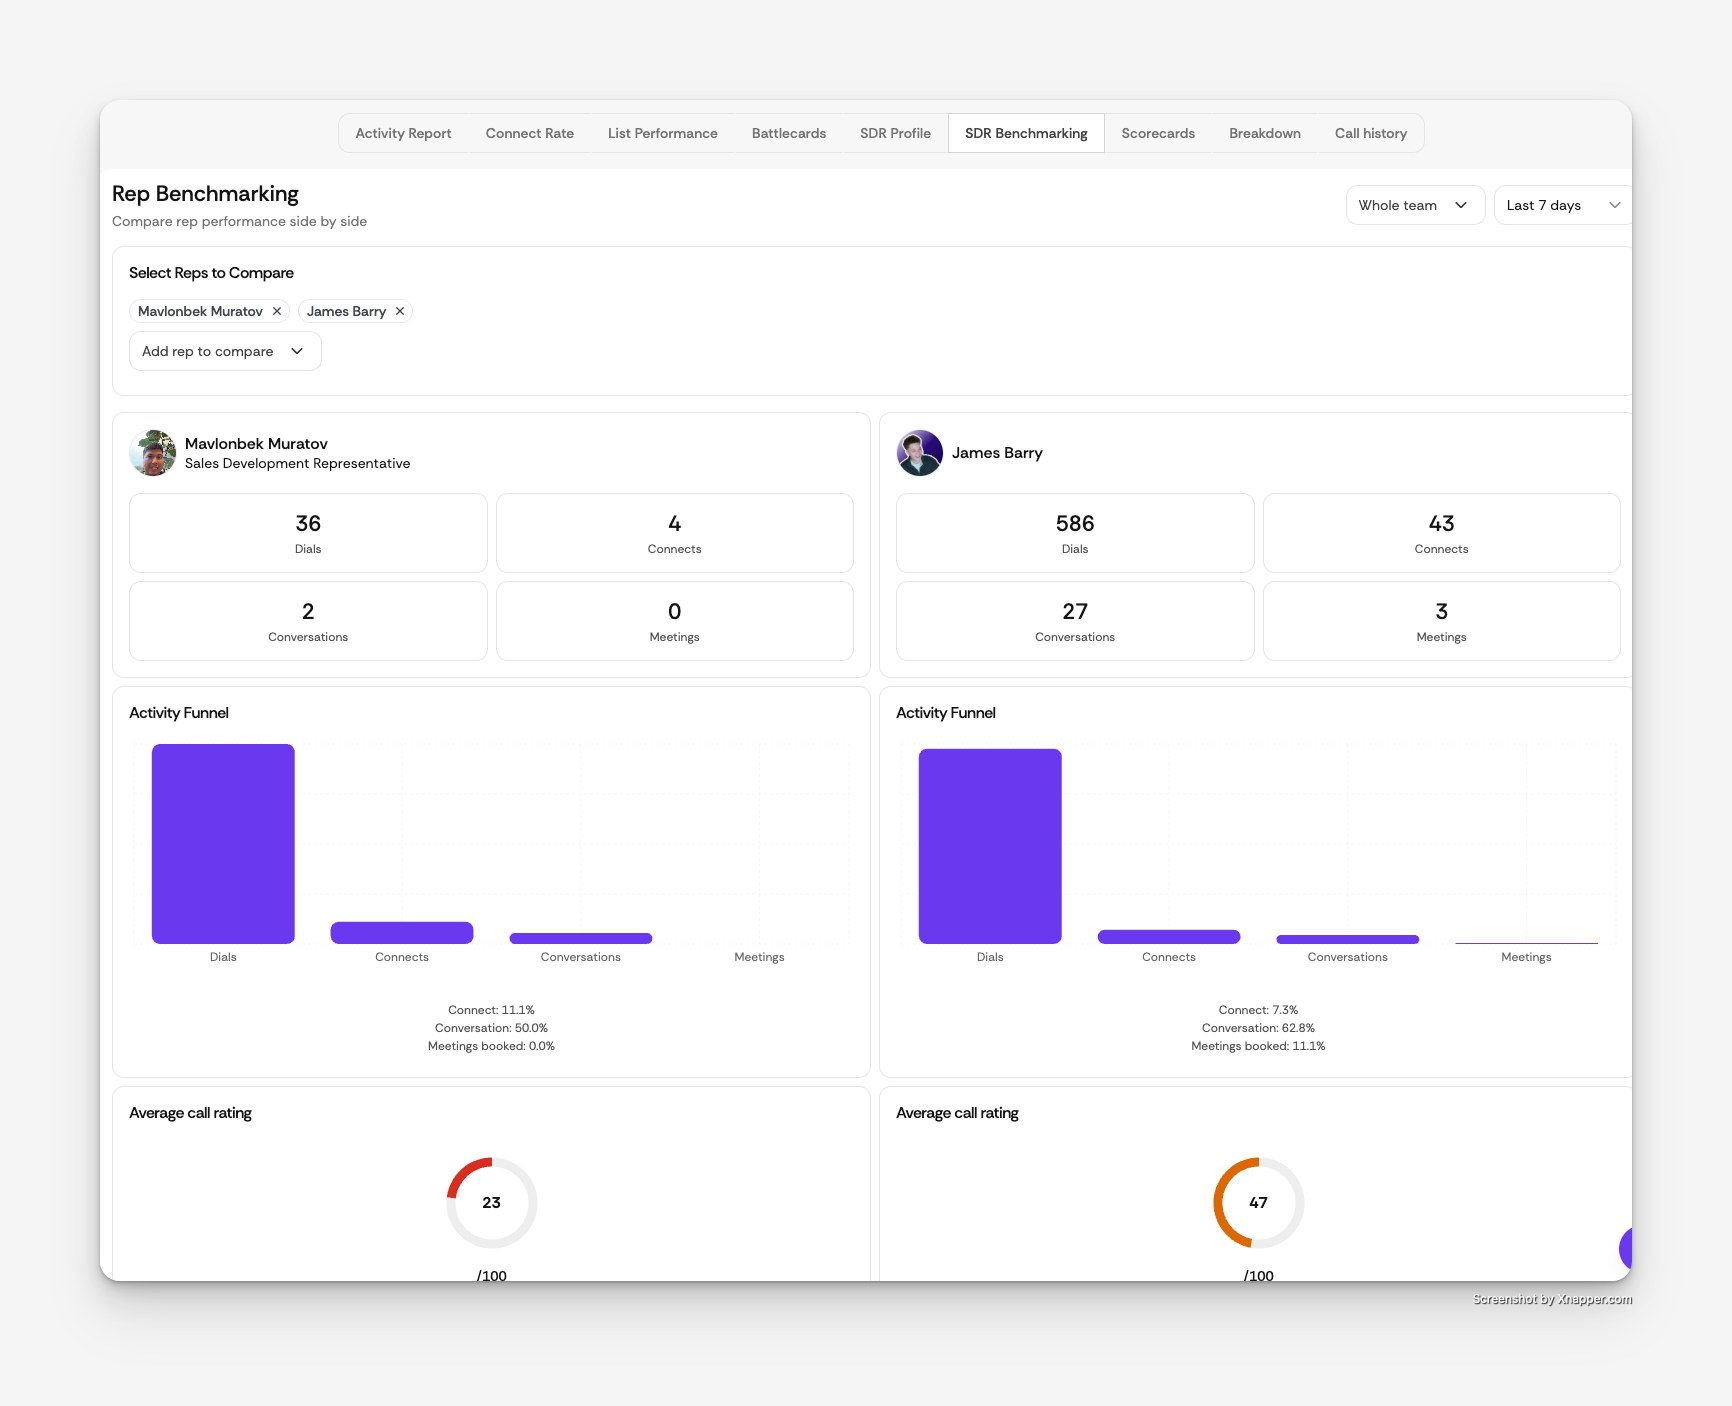
Rep Benchmarking puts two or more reps side by side, one column each. Add reps with Add rep to compare (at least 2 required), pick a window of 7, 30, or 90 days, and compare the same stack per rep: overview numbers, Activity Funnel with connect / conversation / meetings-booked rates, Average call rating (out of 100), the six-skill competency radar, Prospect Reactions, Top Objections, and Persona Targeting.
Tip
Use SDR Profile to diagnose one rep in depth, and SDR Benchmarking to spot differences — e.g. why one rep books more from the same list.
Scorecards (AI call scoring)
Every connected call is scored automatically by AI — there's nothing to trigger. Scorecards usually appear within a minute or two after a call ends.
The Scorecards tab
A searchable table of all scored calls with: contact, rep, disposition, the overall score out of 100 with a letter grade (A+ through F), six facet scores out of 5 — Intro, Discovery, Pitch, Tonality, Objection Handling, CTA — the objections the AI detected, duration, and date. Filter by Users and Score Grade, search, and page through; click any row to open the full scorecard.
The full scorecard
Overview — total score, key gaps, and an AI analysis of the call.
Behavioral Feedback — duration, talk ratio, questions asked, open questions, interruptions, pitch duration.
Targeting, Messaging & Persona Feedback — lead profile (budget owner, decision maker, timeline, fit score, tech stack mentioned…), persona/industry fit, and a messaging recommendation.
Individual Facet Scorecards — each of the six skills with its metrics and transcript evidence.
Coaching Opportunities — AI-generated Top Wins, Top Opportunities, and Suggested Drills.
Use the on-screen arrows (or your keyboard's ← / → keys) to flip between scorecards, and Share link to generate a public link — great for sharing a standout call with someone outside Salesfinity.
Breakdown
The Breakdown tab is your table view: five stacked, searchable, sortable tables, each with its own Download button for CSV export.
Table | Key columns |
|---|---|
List Performance | Name, Integration, Dials, Outbound connects, Conversations, Meetings, Conv. to meeting %, Data quality |
SDR Performance | Name, Calls dialed, Avg. connection, Avg. conversation, Avg. dials/day, Total talk time, Meetings set, Conv. to meeting %, Data quality |
Sequence Performance | Name, Source, Total calls, Connected calls, Conversations, Meetings, Conv. to meeting %, Good quality contacts, Data quality |
Salesfloor Performance | Name, Sessions, Total floor time, Avg session time, Dials on floor, % Dials on floor, Avg call score |
Data Quality | A donut of good vs. bad contacts across the selected period |
Call History
The complete log of every call, with the deepest filtering in the product.
Filters
Beyond search and date range: Disposition, Users, Call status (Connected / Conversation), Call direction (Inbound / Outbound), Call Recording, Incompleted calls, Call Scoring, Contact list, Sequence, Caller Numbers, and a Call duration range slider. Filters are written into the URL, so any filtered view can be bookmarked or shared.
The table
Each row shows contact, company, both phone numbers, direction, CRM sync status (with error details when a sync fails), rep, date & time, disposition, duration (with an inline play button when a recording exists), and the call's AI score. Sort by name, title, company, duration, or date.
Call details panel
Click a call to open the side panel: the recording player with a Share call details option, and tabs for Details (contact info and call notes), Scoring (when the call was scored), History (contact and account activity), Transcript (searchable — click any line's timestamp to jump the recording there), and Comments.
Managing dispositions
Use the pencil action on your own calls to Change Disposition or log an incomplete call — including notes with an AI Generate summary option, sequence actions, and snoozing the contact.
A View incomplete calls shortcut appears at the top when you have unlogged calls from the last 30 days.
You can only edit dispositions on your own calls, one call at a time.
Exporting and re-dialing
Filter to the calls you want
Apply date, user, disposition, or list filters — or select specific rows with the checkboxes.
Click Download List
Downloads the current selection as a CSV for local analysis.
Or click Export to Dialer
Creates a new contact list from those calls and takes you straight to the dialer — perfect for re-calling no-answers from last week.
Exporting your data
Tab | Export options |
|---|---|
Call History | CSV download + Export to Dialer (full query or selected rows) |
Breakdown | CSV download per table (List, SDR, Sequence, Salesfloor) |
Scorecards | Public share link per scorecard |
Activity Report, Connect Rate, List Performance, SDR Profile, SDR Benchmarking, Battlecards | On-screen only (no export yet) |
Metric definitions
Connect rate
The percentage of calls successfully connected to a live person. A call must last at least 15 seconds to count as a connect; calls that hit voicemail or drop before then are excluded.
Conversation rate
The percentage of calls that result in an actual conversation with a live person — at least 60 seconds of call duration. Voicemails are excluded; a call that reaches the 60-second minimum qualifies even if it disconnects afterwards.
Data quality
The share of good-quality contacts on a list — contacts whose numbers reach the right person. Shown per list, per rep, and as the Data Quality donut on Breakdown.
Call score
The AI's 0–100 rating of a connected call, with a letter grade and six skill facets each scored out of 5 (Intro, Discovery, Pitch, Tonality, Objection Handling, CTA).
List Score
A 0–100 health score for a list or sequence on List Performance: 70+ is Performing Well, 50–69 Needs Attention, below 50 Critical.
In short: connect rate tells you that you reached someone live; conversation rate tells you meaningful engagement occurred.
FAQ
Why can't I see my teammates' data?
The team member filter only offers your teammates (and the Whole Team option) to owners, admins, and members whose team call history access hasn't been restricted by an admin. Otherwise, Analytics shows your own activity.
How do I score a call?
You don't need to — every connected call is scored automatically, and the scorecard appears in the Scorecards tab within a minute or two after the call ends.
Why doesn't a call have a Scoring tab in Call History?
Scoring applies to connected calls with a recording/transcript. Very short calls, voicemails, and unconnected dials don't generate scorecards.
Why is the recording shorter than the call duration?
Duration measures the whole call; recording starts shortly after the call connects, so the two can differ slightly.
Can I change a disposition on someone else's call?
No — you can only update dispositions on your own call logs, one call at a time.
What are P1 / P2 / P3 numbers on the Connect Rate tab?
Number-validation score tiers for mobile numbers: P1 = highest likely-to-answer, P2 = medium, P3 = lowest. Non-mobile or not-yet-validated numbers show as Unverified. BOSS Mode dials P1 first, then P2, and skips P3.
What does the sync status column mean?
Whether each call was synced to your connected CRM(s). A warning means it synced to some CRMs but one rejected it; hover the badge for details on failures.
Where did my date/user selection go?
The date range resets each browser session (back to the default range); your team member selection and saved views persist per user. Set a default saved view to always open Analytics scoped to your pod.